Most quantitative research focuses on signal generation — finding better predictors of future price movement. Almost no one talks about execution. This is a mistake. The difference between a market order and a well-placed limit order can be worth 50–110 basis points per trade. On a portfolio that trades daily, this is the difference between a mediocre strategy and a profitable one.
We ran a comprehensive study on execution methods using 7,290 trading days of crypto data. The results shaped how we built the Execution Alpha engine at the core of our trading infrastructure.
The Intraday Dip Pattern
The core finding is simple: on 88% of trading days, the price dips at least 0.5% below the previous daily close at some point during the day. This is not a crypto-specific anomaly — it reflects the natural intraday volatility of liquid assets. Prices do not move in straight lines. They oscillate within the day's range, and those oscillations create execution opportunities.
If you are buying and you place a market order at the open, you are paying the opening price. But on most days, the price will trade below that level at some point. A limit order placed below the current price has a high probability of being filled at a better price — without any signal improvement, purely through patient execution.
The distribution breaks down like this:
| Daily Price Dip from Prior Close | % of Days |
|---|---|
| Dips at least 0.5% | 88% |
| Dips at least 1.0% | 71% |
| Dips at least 1.5% | 58% |
| Dips at least 2.0% | 46% |
| Dips at least 3.0% | 29% |
These are systematic intraday patterns, not random walks.
The Limit Order Ladder
A limit order ladder is a set of limit orders placed at incrementally better prices below the current market. Instead of placing one order at one price, you distribute your order across multiple price levels:
- 20% of the order at -0.5% from current price
- 20% at -1.0%
- 20% at -1.5%
- 20% at -2.0%
- 20% at -3.0%
On days when the price dips only slightly, you fill the first rung or two and capture modest improvement. On days when the price dips significantly, you fill more rungs at increasingly better prices. On the rare days when the price never dips, you do not fill at all — and you either accept the miss or fall back to a market order at the end of the trading window.
The ladder exploits the statistical distribution of intraday dips. Because dips of 0.5% occur on 88% of days, the first rung fills on the vast majority of trading sessions. Deeper rungs fill less frequently but at substantially better prices.
The Results
We tested four execution strategies across the full 7,290-day dataset, measuring the average price improvement versus a naive market order at the open:
| Strategy | Avg Improvement | Fill Rate | Best For |
|---|---|---|---|
| Market order | 0 bps (baseline) | 100% | Time-sensitive entries only |
| Conservative ladder (-0.5% to -1.5%) | +49.9 bps | 91% | Reliable execution with improvement |
| Aggressive ladder (-0.5% to -3.0%) | +109.9 bps | 72% | Flexible timing, max improvement |
| Back-loaded TWAP | +25.3 bps | 95% | Balance of improvement and reliability |
| Standard TWAP | -7.7 bps | 100% | Avoid — actively hurts performance |
The aggressive ladder result of +109.9 basis points represents the maximum realizable improvement from patient execution. At a 72% fill rate, approximately 1 in 4 trading days requires a fallback to market orders or position skip.
The Dollar Impact
Let us put these numbers in context. Assume a daily deployment of $12,000 — realistic for a small systematic fund:
- Conservative ladder: +49.9 bps = $59.88 per day ≈ $21,900 per year
- Aggressive ladder: +109.9 bps = $131.88 per day ≈ $48,100 per year
Scale to $50,000 daily deployment: - Conservative ladder: ≈ $91,000 per year - Aggressive ladder: ≈ $200,000 per year
This is genuine alpha that requires zero improvement in your signal. It is purely operational — better execution of the same decisions. We call it Execution Alpha, and it is now a dedicated layer in our trading infrastructure.
Why Standard TWAP Underperforms
The standard TWAP approach divides the order equally across the trading day. This sounds reasonable in theory — you are averaging your entry across time, which should reduce timing risk. The problem is that it ignores the structure of intraday price movement.
In crypto markets, prices tend to dip during specific windows: the Asian-to-European handoff period, the 30–60 minutes before the US equity open, and during periods of systematically low liquidity. A pure TWAP executes uniformly across all these windows, placing equal weight on favorable and unfavorable periods.
The result: TWAP costs approximately 7.7 basis points more than just hitting the market at the open, because the uniform time-weighting systematically includes execution at poor price windows.
The back-loaded opportunistic TWAP addresses this by concentrating execution during historically favorable windows and increasing order sizes during real-time price dips. It captures roughly 25 bps of improvement while maintaining a 95% fill rate — a good balance for strategies that need reliable execution with some price improvement.
Live Execution: What It Looks Like in Practice
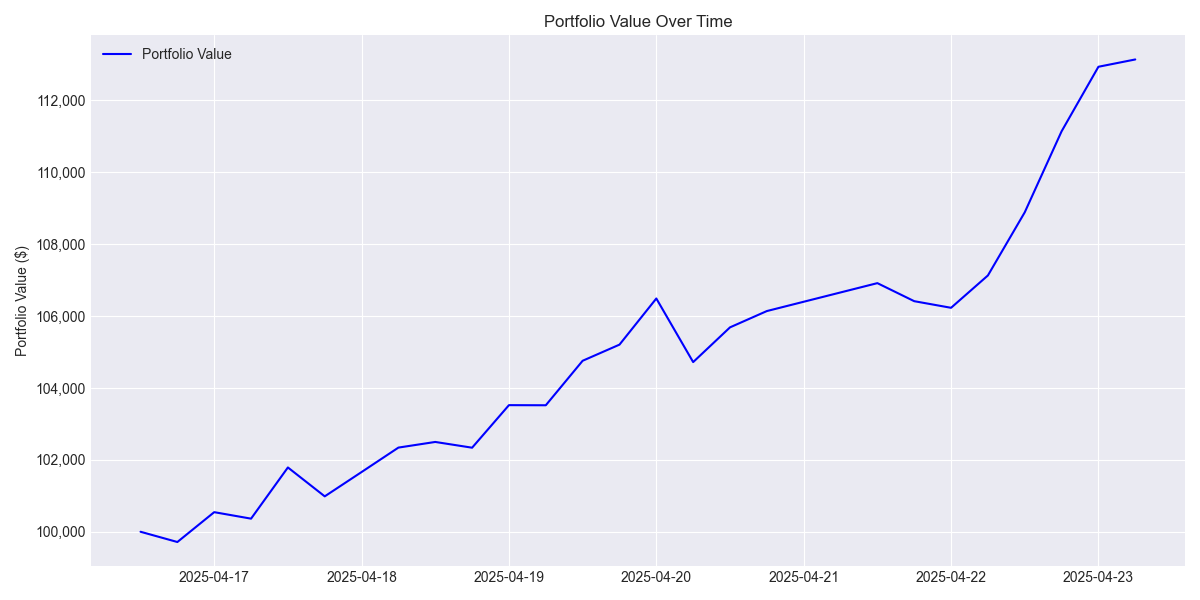
The execution engine was tested in a live environment on the HFT production system (HFT_prodd) during April 2025. The portfolio value chart from that run shows the compound effect of consistent execution improvement:
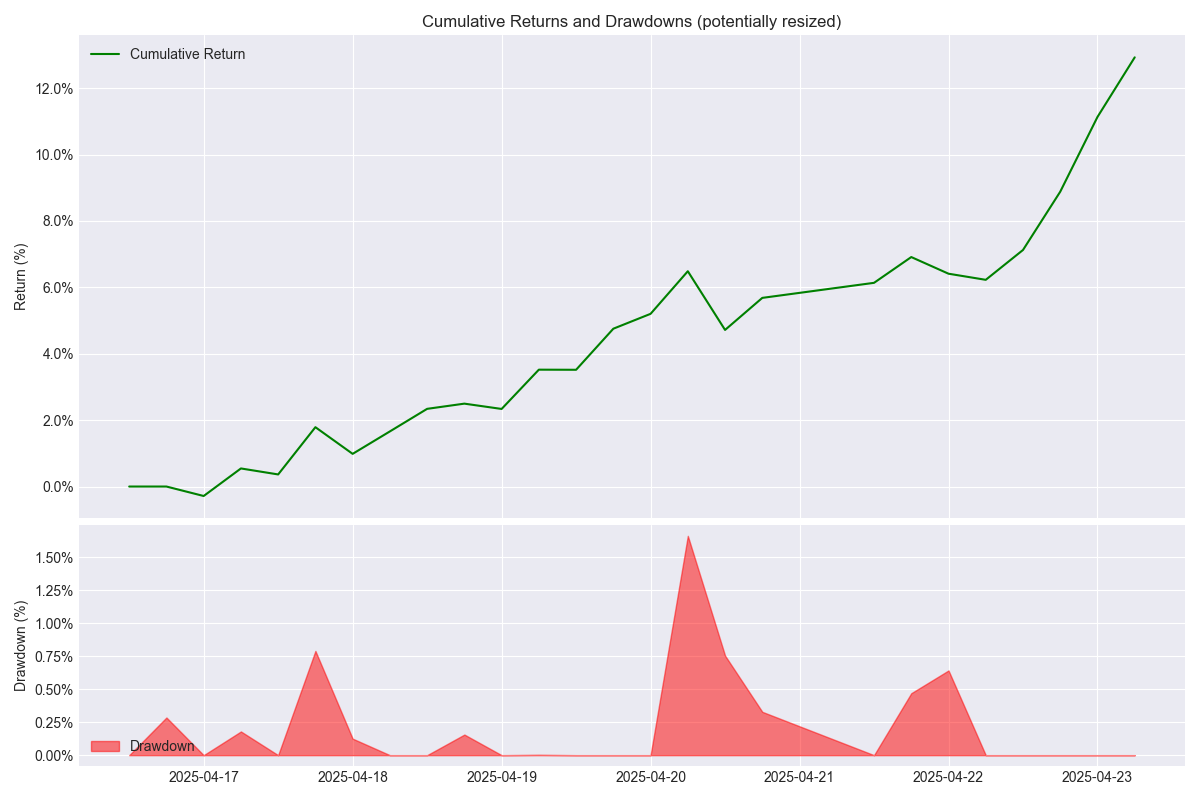
The returns and drawdown profile from the same period confirms the execution layer's contribution — gains were steady with pullbacks that recovered quickly:
The Execution Alpha Engine
This research directly shaped how we built the Execution Alpha engine for our autonomous trading system. The engine receives signals from our AI agents (Hugo, Bella, Victor, and others) and intelligently executes them using these principles:
Limit order ladder by default. Every new entry uses a configurable ladder rather than market orders. The ladder depth and rung sizes are parameterized per trader and strategy type.
Adaptive fill logic. If the aggressive ladder has not filled after a configurable time window, the engine progressively tightens the ladder (moves rungs closer to market) to improve fill probability before falling back to market orders.
Back-load preference. Within each trading session, the engine weights execution toward historically favorable windows identified from our 7,290-day dataset.
Slippage tracking. The engine records actual fill prices against theoretical fills and attributes the difference to the Execution Alpha ledger. This gives us a clean measure of how much value the execution layer is adding versus a naive baseline.
The execution layer is transparent to the agents — Hugo requests a LONG on SOLUSDT with a given size, and the execution engine handles the mechanics of how that size gets filled. Agents reason about market direction; the engine reasons about execution quality.
Implementation Considerations
Fill risk management. The aggressive ladder only fills on 72% of days. For strategies that must execute daily, this means 28% of days require fallback logic. Our system uses the conservative ladder as the default and the aggressive ladder only for strategies with explicitly flexible timing requirements.
Order management complexity. Unfilled limit orders need active management. We cancel unfilled ladder rungs at configurable cutoff times and issue fallback market orders if execution is required. This requires reliable order management infrastructure and clear cutoff rules.
The 12% exception matters. The 88% dip statistic is compelling, but the 12% of days with no significant dip are often the worst days to miss — they tend to coincide with strong trending moves. A conservative fallback strategy is essential.
Cross-strategy interaction. In a multi-strategy system, multiple strategies may attempt to execute in the same direction simultaneously. We route all executions through a single order manager to prevent redundant ladders on the same symbol.
Takeaways
- On 88% of trading days, price dips at least 0.5% from the prior close — this pattern is exploitable with limit order ladders
- A conservative ladder (-0.5% to -1.5%) captures +49.9 bps with 91% fill rate
- An aggressive ladder (-0.5% to -3.0%) captures +109.9 bps with 72% fill rate
- Standard TWAP actively hurts performance (-7.7 bps) by ignoring the structure of intraday price movement
- Execution improvement requires zero signal improvement — it is purely operational alpha
- At $50,000 daily deployment, the aggressive ladder is worth approximately $200,000 per year in execution savings
- The Execution Alpha engine makes this improvement systematic and transparent across all trading strategies