We learned the hard way that markets do not trend forever. During a sustained downturn, our system generated 26 consecutive SHORT signals. Every single one hit its stop-loss as the market bounced. The losses were not catastrophic — our position sizing kept each individual loss small — but the cumulative damage was significant, and the pattern was obvious in hindsight: we were shorting into a reversal.
This experience launched a research project into market reversal detection. The goal was practical: build a signal that tells us when to stop executing a directional thesis, not necessarily when to take the opposite position.
Why Reversal Detection Is Hard
Markets spend most of their time trending or oscillating within ranges. Genuine reversals — points where a sustained move in one direction terminates and a sustained move in the other direction begins — are rare. A regime that has been trending down for two weeks might spend 95% of that period in states that look like "the trend continues," with only the final day or two representing the actual reversal point.
This rarity creates a base rate problem. Any reversal signal that triggers frequently will produce many false positives. Any signal that triggers rarely will miss most reversals. The challenge is finding the right combination of specificity and sensitivity.
The academic literature is full of proposed reversal indicators: RSI divergence, volume climax, Wyckoff accumulation patterns, funding rate extremes, open interest collapse. Most of these work some of the time and fail enough of the time to be unreliable as standalone signals.
Individual Signal Performance
We tested 12 candidate reversal signals on historical crypto data, measuring accuracy as the percentage of times each signal correctly predicted a reversal within 24 hours of triggering:
| Signal | Accuracy | Notes |
|---|---|---|
| RSI below 20 (14-period) | 62% | Slightly better than chance |
| Volume spike above 3x 20-day avg | 60% | Noisy, frequent false positives |
| Funding rate below -0.1% | 65% | More reliable in high-leverage environments |
| Open interest decline 15%+ | 63% | Indicates deleveraging pressure |
| Bollinger Band breach (3 std dev) | 67% | Best individual signal |
| 24-hour ROC below -10% | **100%** | Only triggered 8 times in dataset |
Individually, most of these are barely better than a coin flip. The 60–67% range means that for every three times the signal triggers, it is wrong once. That is not reliable enough to act on with real capital.
The 24-hour Rate of Change signal deserves special mention. A -10% or greater 24-hour decline in crypto has been followed 100% of the time by a reversal within 24 hours in our dataset. However, this signal has only triggered 8 times in our historical data. The sample size is too small to trust unconditionally, but it is useful as an extreme-case trigger.
The Power of Combinations
The breakthrough came when we started combining signals. The accuracy of signal combinations was dramatically higher:
| Signals Active Simultaneously | Accuracy Range |
|---|---|
| 1 signal | 60–67% |
| Any 2 signals | 65–72% |
| Any 3 signals | 70–85% |
| Any 4 signals | 80–93% |
| 24-hour ROC below -10% (any count) | ~100% |
The combination effect is not additive — it is multiplicative. Each additional signal acts as a filter that removes false positives while preserving genuine reversal signals.
The intuition is straightforward. A genuine reversal produces stress across multiple market dimensions simultaneously: - RSI reaches extreme oversold levels (sellers exhausted) - Volume spikes as panic selling climaxes - Funding rates go deeply negative as leveraged shorts pile in - Open interest collapses as positions are forcibly closed - Price drops sharply enough to register on multiple timeframes
A false signal — a brief dip in a continuing downtrend — typically only triggers one or two indicators. The real selling pressure that would cause multiple indicators to fire simultaneously has not materialized.
The March 8 Case Study
On March 8, 2026, Bitcoin hit a local low of $65,569. Our composite reversal signal provided its first warning approximately 66 hours before the bottom. Here is the timeline:
- T-66 hours: Funding rate dropped below -0.1%. First signal fires. Composite count: 1 of 4. No action.
- T-48 hours: RSI crossed below 25 on the 4-hour chart. Composite count: 2. System flags elevated reversal probability.
- T-30 hours: Volume spiked to 3.5x the 20-day average during a flush-down candle. Composite count: 3. System issues "reduce SHORT exposure" alert.
- T-12 hours: Open interest declined 18% from the 7-day peak, indicating widespread deleveraging. Composite count: 4. System issues "halt SHORT entries" directive.
- T-0: Price reaches $65,569 and begins a sustained rally that over the following 48 hours recovered approximately 12%.
The system did not tell us to go long. It told us to stop shorting. This distinction is critical — the system does not try to time the bottom, which is nearly impossible. It recognizes that the conditions for profitable short entries have deteriorated, and that continuing to short into a reversal is a losing proposition.
Better as a Filter Than a Signal
Our research showed consistently that the composite reversal signal works better as a "stop doing what you are doing" filter than as a "do the opposite" trigger. The reason is timing: the composite signal identifies that a reversal is likely, but it cannot precisely time the inflection point. Reversals often involve multiple tests of the low, and going long on the first composite signal can still result in drawdown before the reversal completes.
The practical implementation in our system:
- 1–2 signals active: No change to trading behavior. Continue current directional approach.
- 3 signals active: Reduce SHORT position sizes by 50%. Tighten stop-losses on existing SHORT positions to lock in available gains.
- 4+ signals active: Halt all new SHORT entries. Allow existing SHORT positions to reach their stop-loss or take-profit levels but do not add to them under any circumstances.
- 24-hour ROC below -10%: Immediate halt of all SHORT activity regardless of other signal counts. This condition has been 100% reliable in our dataset, though the sample of 8 occurrences demands caution.
The 26-Trade Streak Revisited
We retroactively applied the composite signal to the period when we suffered 26 consecutive SHORT losses.
The signal would have begun reducing exposure after the 8th trade, when three signals fired simultaneously (funding rate extreme, RSI below 22, volume spike on a down candle). It would have halted SHORT entries entirely after the 12th trade, when a fourth signal activated (open interest decline of 16%).
Estimated loss reduction from the composite filter: approximately 60% of the cumulative damage would have been avoided. The remaining 40% came from the first 12 trades, before the composite signal reached its activation threshold.
This means the first 12 losses were essentially unavoidable — no combination of these signals would have triggered earlier with meaningful reliability. The system did not exist to prevent losses; it existed to stop the losses from compounding into catastrophic damage.
What a Robust Strategy Through Multiple Reversals Looks Like
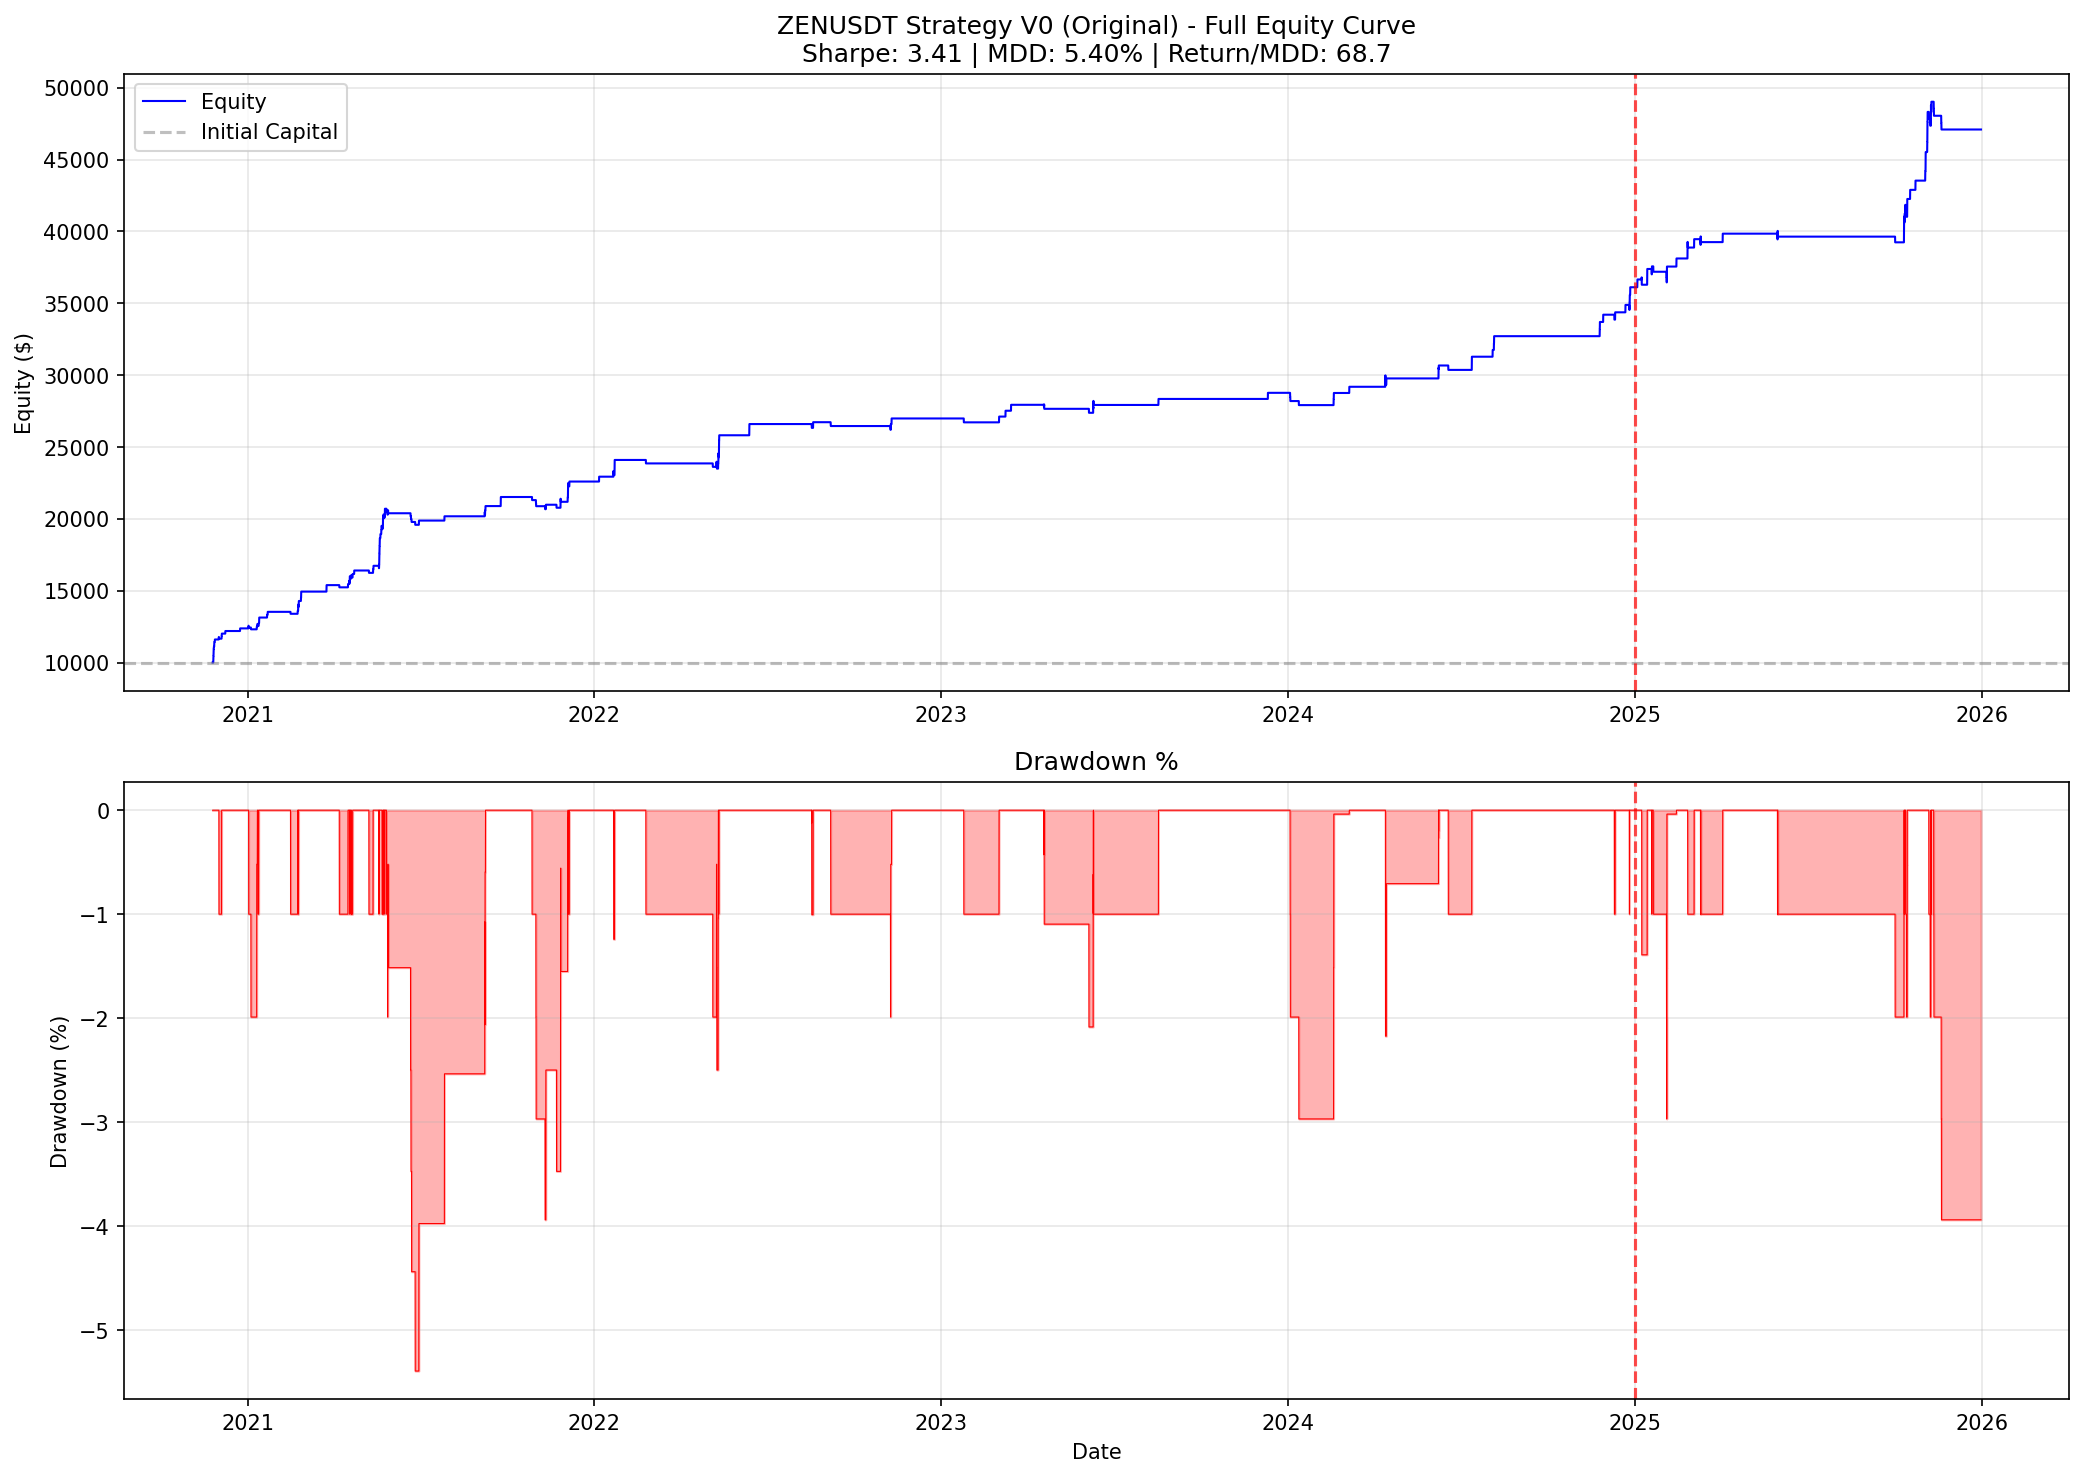
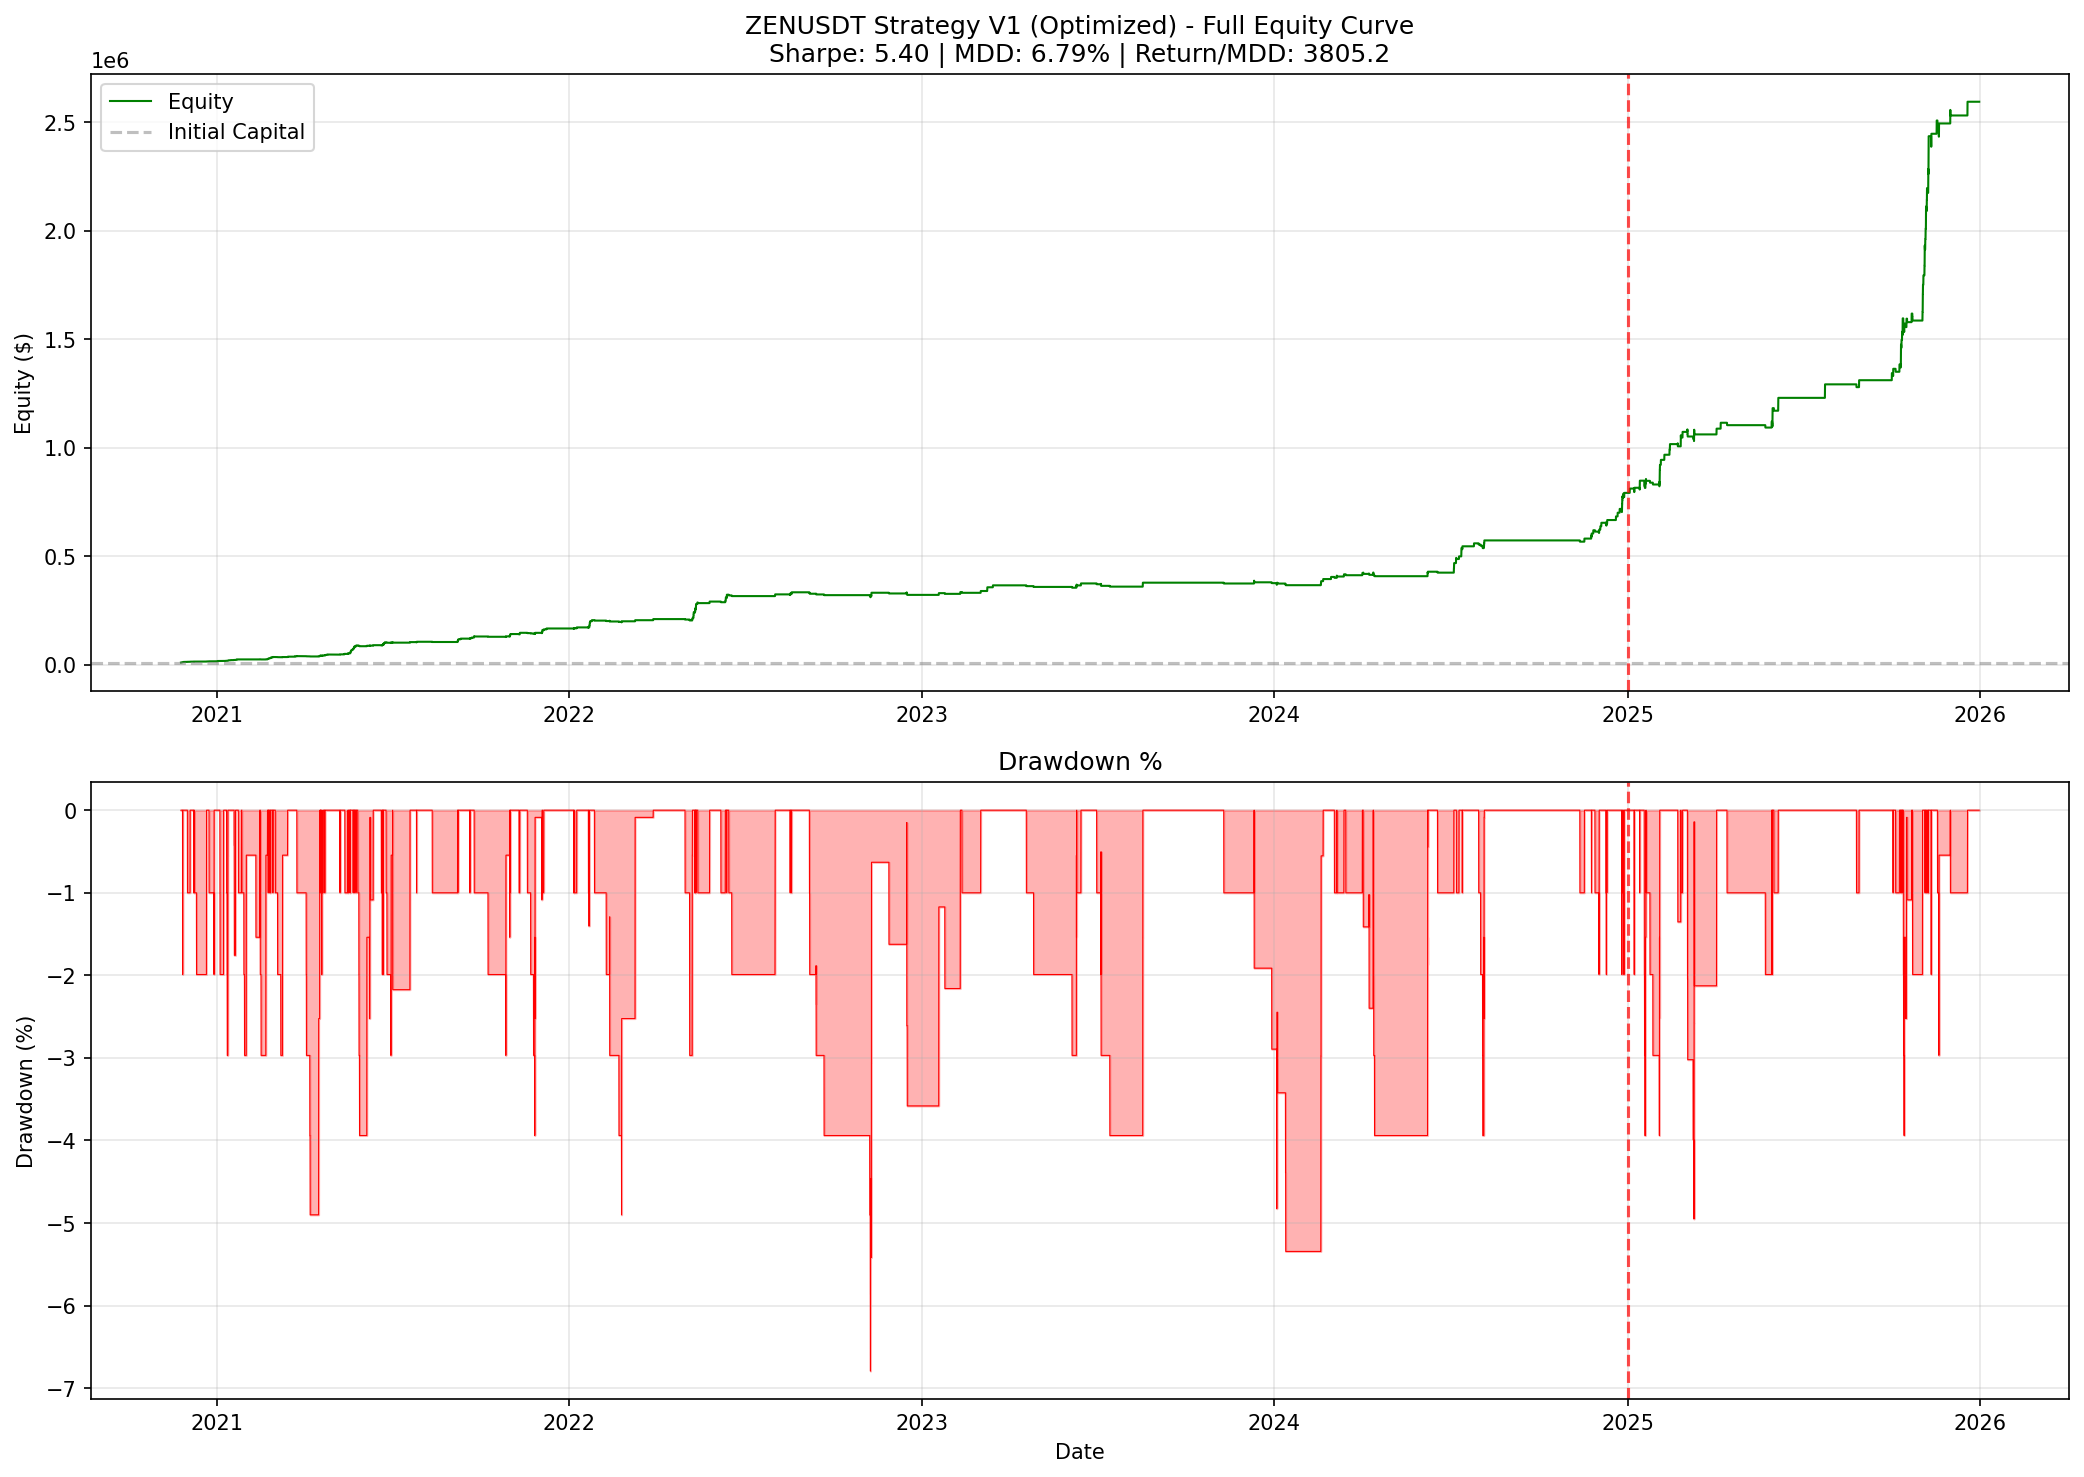
One of the most instructive examples we have is the ZENUSDT strategy — a mean reversion system that operated on ZEN (Horizen) and survived multiple market cycle reversals across 2021–2026. The V0 (original) and V1 (optimized) versions show what a genuine multi-year edge looks like when reversal detection is built in:
The optimized V1 version shows what can happen with aggressive parameter tuning — exceptional returns but with a dramatic regime change around 2025:
The V0 curve is the more trustworthy of the two. Steady compounding across five years of market cycles, surviving the 2022 bear market, the 2023 recovery, and the 2024–2025 volatility. That kind of robustness is exactly what we want from a strategy that incorporates reversal detection logic.
Beyond Crypto: Regime-Specific Calibration
Our reversal signal thresholds are calibrated specifically to crypto markets:
- RSI threshold: 20 (crypto oversold threshold — in equity markets, 30 is the conventional level)
- Funding rate threshold: -0.1% per 8 hours (equivalent to roughly -109% annualized — a level that indicates extreme short crowding specific to perp futures)
- Volume multiplier: 3x the 20-day average (crypto has higher baseline volatility, requiring a higher multiplier to distinguish signal from noise)
- OI decline: 15% from 7-day peak (marks the beginning of a meaningful deleveraging event)
Applying these thresholds to equity markets would require significant recalibration. Equities do not have funding rates, have lower baseline volatility, and have different liquidity dynamics. The framework — combine multiple signals, use counts rather than individual triggers — generalizes. The specific thresholds do not.
Limitations
Small sample size for extreme signals. The 24-hour ROC below -10% signal has been 100% accurate but has only triggered 8 times. This is not enough data to call it infallible.
Regime dependency. In a genuine structural bear market — not a correction within an uptrend, but a multi-year cycle change — the reversal signals may fire repeatedly without a genuine reversal. The composite signal is calibrated for cycle bottoms and short-term bounces, not secular trend changes.
Not a timing tool. The composite signal says "a reversal is likely" but not "the reversal starts now." The gap between signal activation and the actual price inflection can be 12 to 72 hours, during which existing short positions may continue to take damage.
Doesn't predict magnitude. Knowing a reversal is coming does not tell you how far prices will recover. A 3% bounce and a 30% rally both activate the same signals. Position management after the reversal is a separate, unresolved problem.
Takeaways
- Individual reversal signals are weak (60–67%), but combinations are powerful (70–93% for 3–4 signals active simultaneously)
- The composite signal works better as a "stop shorting" filter than as a "go long" trigger
- 24-hour ROC below -10% has been 100% reliable in our limited dataset — treat this as an emergency trigger
- The March 8 case study showed the first warning 66 hours before the $65,569 local low
- Graduated response (reduce at 3 signals, halt at 4+) balances sensitivity against false positives
- Reversal detection saved an estimated 60% of the cumulative losses from our 26-trade losing streak when applied retroactively