We have a problem. We built a mean reversion strategy that shows exceptional backtesting results, and we do not fully trust them.
This post is about the tension between exciting research findings and honest evaluation — and why we are publishing results that include a substantial asterisk rather than waiting until we are confident enough to make a clean positive claim.
The Strategy: OptMR_FastExit
OptMR_FastExit is a mean reversion strategy operating on 15-minute bars. The core logic:
When price deviates significantly from a short-term exponential moving average, measured by z-score, the strategy enters a position in the direction of the mean and exits aggressively when price reverts. The "FastExit" in the name refers to the take-profit targets — we aim to capture small, high-probability moves rather than riding full reversions to the mean.
Entry criteria mirror those used by Bella, our mean reversion agent: - Z-score must be between 2.5 and 4.0 (extended but not catching a falling knife) - Exit when z-score reverts to 0.5 of the entry distance - Force exit if z-score extends to 5.0 (setup failed) - Maximum holding period: 24 hours
The Backtested Results
On the 2022 bear market period — chosen as a genuine out-of-sample test because the strategy was developed on 2020–2021 data:
| Metric | Value |
|---|---|
| Sharpe ratio | 4.52 |
| Cumulative return | +32% |
| Maximum drawdown | -3.8% |
| Win rate | 71% |
| Average holding period | 47 minutes |
These numbers are remarkable, particularly given the context. During the 2022 bear market, a buy-and-hold position in BTC lost approximately 65%. Most systematic strategies were flat or negative. OptMR_FastExit generated consistent positive returns with minimal drawdown.
The return-to-drawdown ratio of 32%/3.8% = 8.4 is exceptional. The 47-minute average holding period means the strategy trades dozens of times per month, providing statistical significance within a single year.
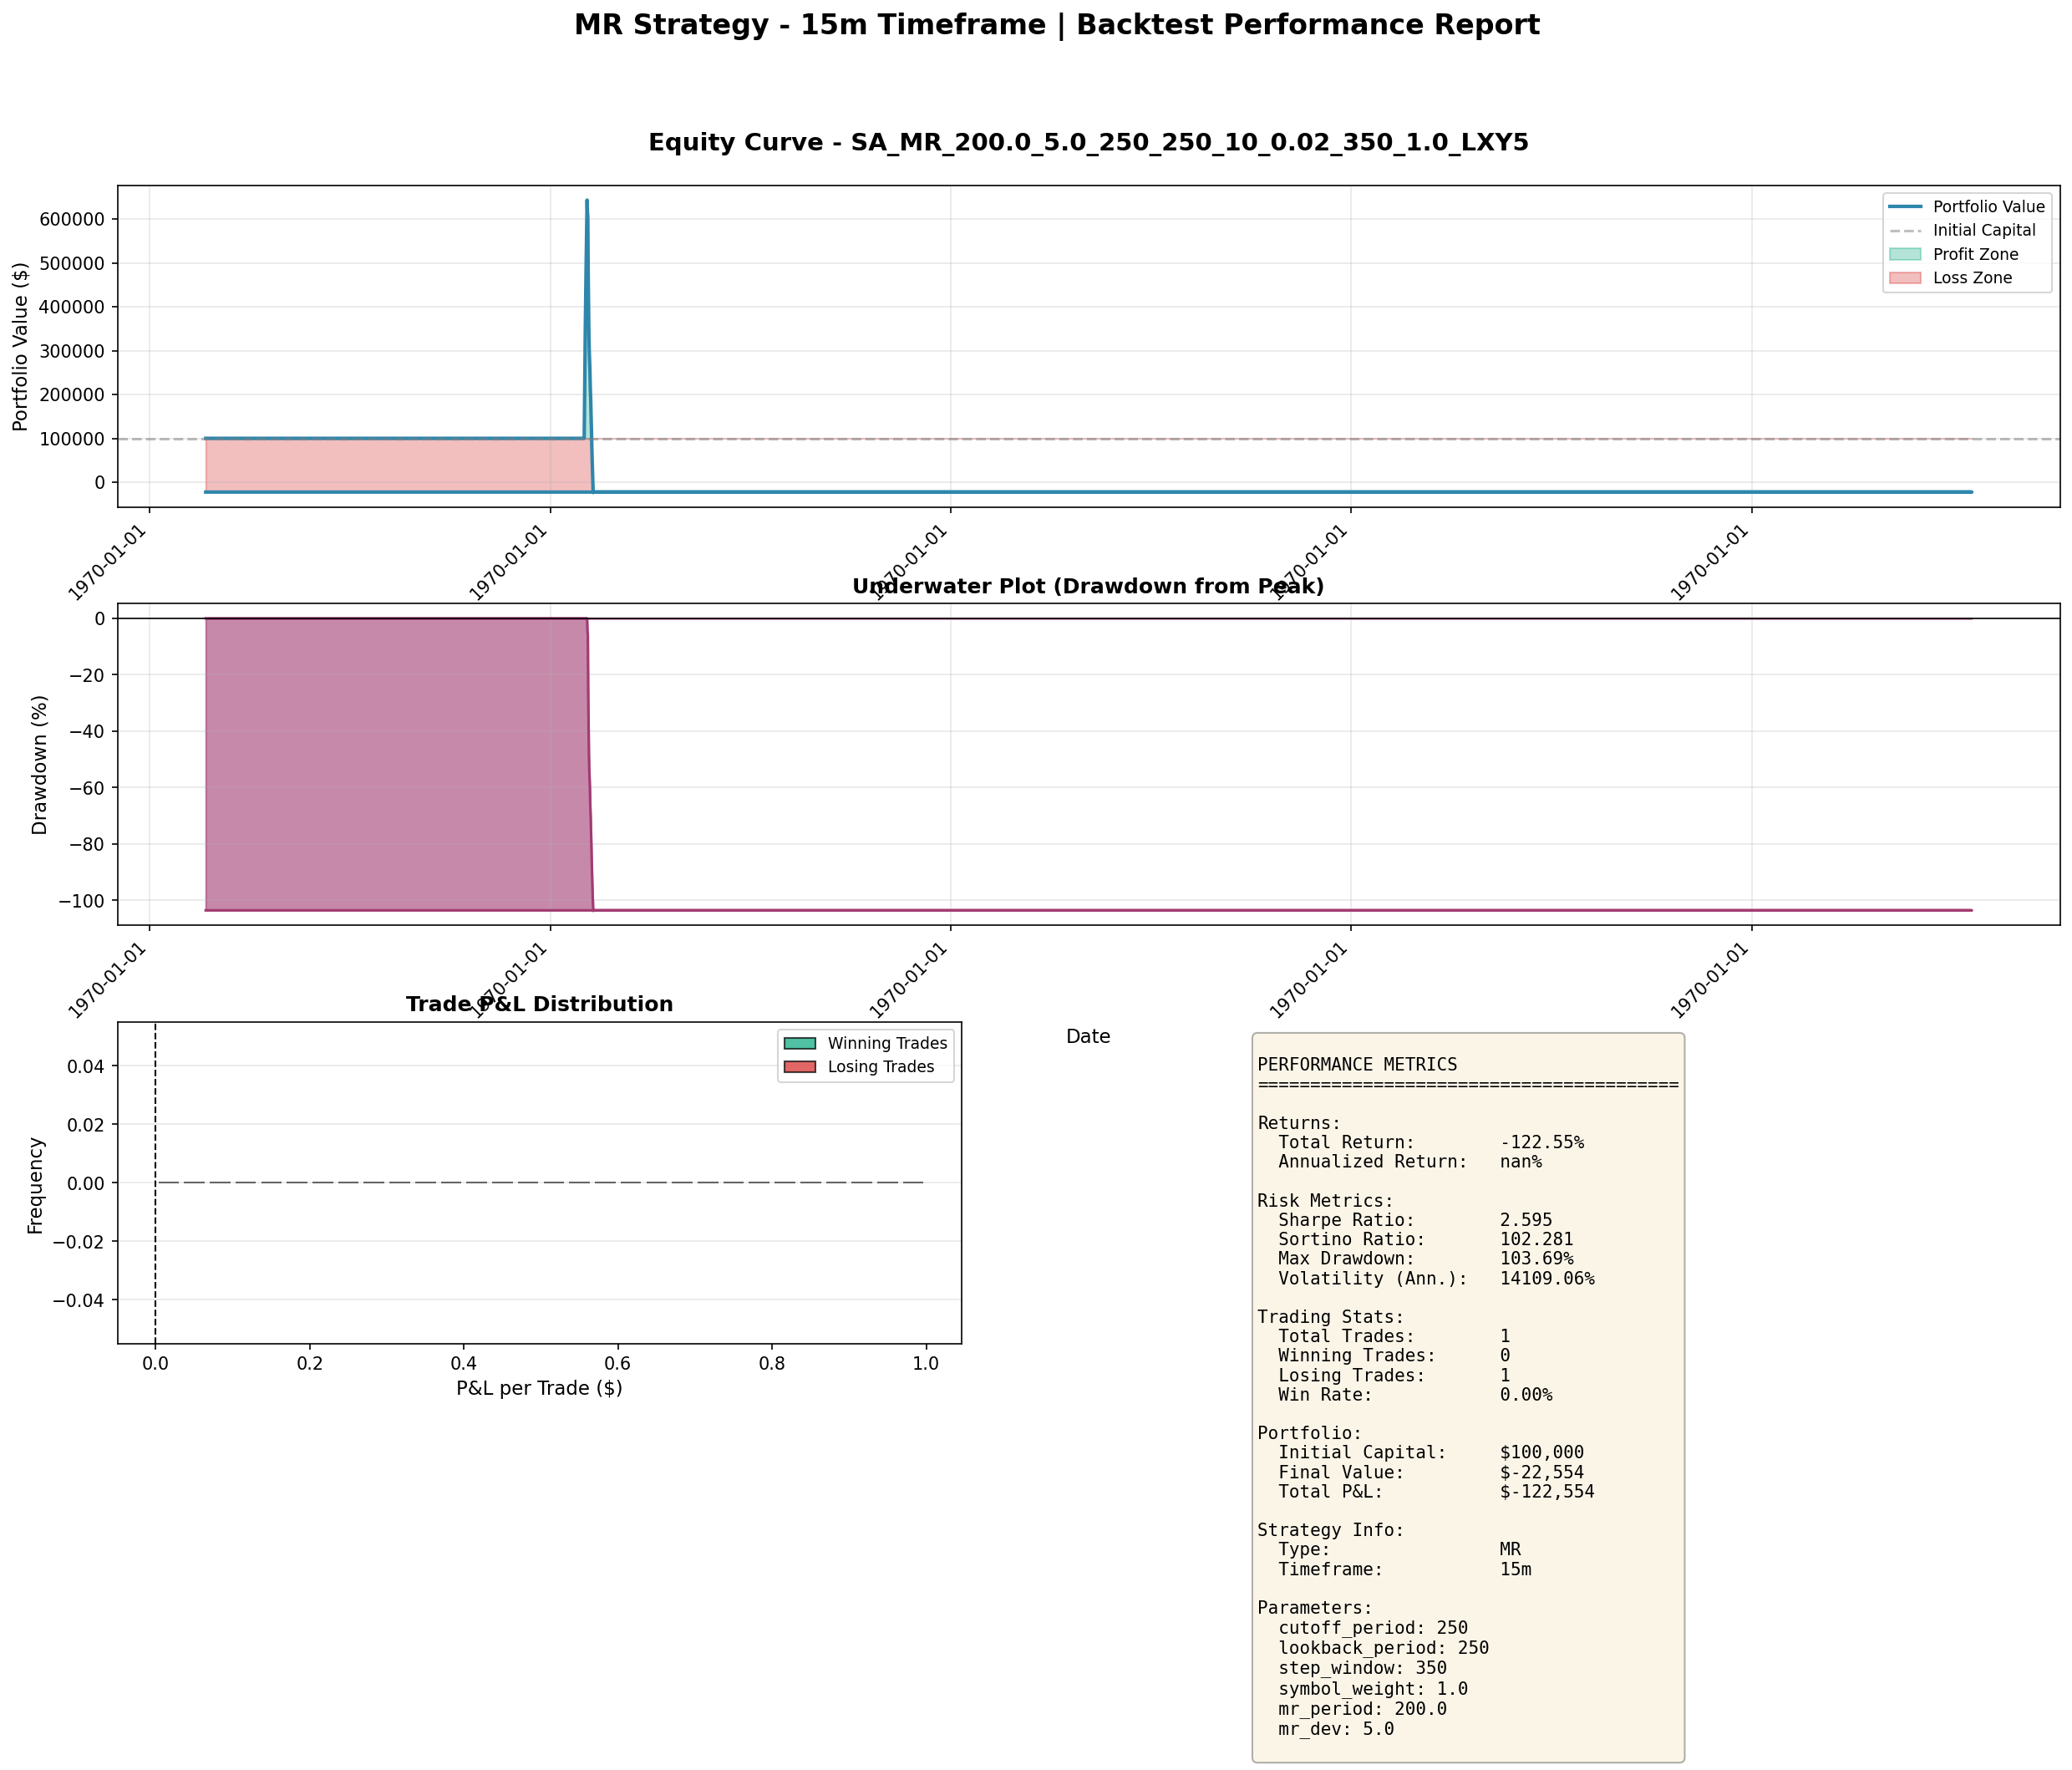
Here is what the actual MR strategy backtest output looks like on 15-minute bars. This is the equity curve, underwater plot, and trade P&L distribution from a real strategy run:
Why We Do Not Trust It
Our own backtesting evaluation guidelines — developed after the Sharpe 5 look-ahead bias incident we wrote about in a previous post — state clearly: any Sharpe ratio above 3.0 should be treated as suspicious until proven otherwise.
OptMR_FastExit's Sharpe of 4.52 trips this threshold.
More concerning: when we break the 2022 bear market into quarterly sub-periods, the Sharpe ratios vary dramatically:
| Quarter | Sharpe |
|---|---|
| Q1 2022 | 2.1 |
| Q2 2022 | **15.68** |
| Q3 2022 | 3.4 |
| Q4 2022 | 1.8 |
That Q2 figure of 15.68 is a massive red flag. No legitimate strategy achieves a Sharpe of 15 over a full quarter. The Medallion Fund, the greatest trading operation in history, achieves approximately 2–3 after fees on an annual basis.
We have audited the code three times for look-ahead bias. We have verified the .shift(1) rule on all features. We have checked for data errors in our Q2 2022 price series. We have validated that OHLC consistency holds (high >= open/close, low <= open/close). We have not found a bug.
But the Q2 Sharpe of 15.68 remains unexplained, and that makes us uncomfortable. Our prior hypothesis is that Q2 2022 was a period of unusually high intraday volatility combined with frequent sharp reversals — a regime particularly favorable to a fast-exit mean reversion strategy. But "favorable regime" alone should not produce a Sharpe of 15. The unexplained nature of this result is itself a warning sign.
Why Mean Reversion Dominates on Short Timeframes
The theoretical case for mean reversion on 15-minute bars is strong, regardless of the suspicious backtested Sharpe.
At short timeframes, price is dominated by microstructure noise: bid-ask bounce, order flow imbalance, temporary liquidity gaps, and the mechanical behavior of market makers. These forces systematically push price away from fair value and then pull it back. The deviation-and-reversion cycle is a reliable feature of market microstructure — it is observed in equities, futures, and crypto across all liquid markets.
Momentum, by contrast, dominates on longer timeframes (daily to weekly) where information incorporation, trend-following funds, and sustained directional flows drive persistent moves.
We tested a pure momentum strategy (same universe, same time period) on 15-minute bars:
- Momentum on 15-minute bars: Sharpe -0.62
Momentum actively loses money at this timescale. Mean reversion dominates by a wide margin. This is consistent with the academic literature on intraday return autocorrelation, which shows negative serial correlation (mean reversion) at short lags and positive serial correlation (momentum) at daily and longer lags.
The theoretical foundation for mean reversion on 15-minute crypto bars is solid. The question is whether OptMR_FastExit is correctly capturing this effect, or whether the backtest is overclaiming.
What Needs to Happen Before Deployment
Before we would consider running OptMR_FastExit with real capital, it must pass the following tests:
Out-of-sample validation on 2023–2025 data. The 2022 results are technically out-of-sample (the strategy was developed on 2020–2021 data), but we need performance across multiple market regimes. A strategy that only works in bear markets is situationally useful but operationally limited. We expect mean reversion to be regime-neutral, but we need the data to confirm.
Q2 2022 investigation. We need to either explain the Sharpe of 15.68 as a genuine regime effect or find the subtle bug we have missed. Acceptable explanations would be: (a) specific Q2 2022 features that will not recur and can be modeled, (b) a data-specific anomaly that affected our price series, or (c) a discovered bug. Until this is resolved, we cannot trust the full-year Sharpe.
Transaction cost stress testing. At 47-minute average holding periods on 15-minute bars, execution quality is critical. We need to rerun with: - 1x estimated transaction costs (baseline) - 2x transaction costs (stress test) - 3x transaction costs (extreme stress) - 5x transaction costs (catastrophic scenario)
If the strategy is robust, the Sharpe should degrade gracefully, not catastrophically. A strategy that only works with near-zero costs is not deployable.
Paper trading validation. Before committing capital, we will run OptMR_FastExit in paper trading mode for at least 3 months, generating real signals and tracking whether they match the backtest distribution. Any significant deviation triggers a full re-audit.
Regime robustness check. We need to test whether the Q1 and Q4 2022 Sharpe figures of 2.1 and 1.8 — the "normal" sub-periods — represent the strategy's true performance envelope, or whether the overall 4.52 is anchored by the anomalous Q2. A strategy with typical Sharpe of 1.5–2.0 and occasional excellent periods is a very different risk profile from one with typical Sharpe of 0.8–1.5 and occasional extraordinary periods.
The Honest Path
We could have written this post differently. We could have led with "+32% during the 2022 crash" and buried the caveats in a footnote. That is the typical approach when marketing a quant strategy.
We are leading with the asterisk because the quantitative finance industry would be better off with more honest communication about research uncertainty. A Sharpe of 4.52 sounds impressive in isolation. A Sharpe of 4.52 driven by a sub-period Sharpe of 15.68, with no explanation for that sub-period figure, and no out-of-sample validation beyond one market regime — that is a research result that needs more work before it deserves capital.
Mean reversion on short timeframes is a real, well-documented phenomenon. OptMR_FastExit may be a genuinely excellent strategy. Or it may be a well-coded strategy that got lucky in its development period. We do not yet know which. We will share the validation results as they accumulate.
Takeaways
- Mean reversion dominates on 15-minute bars (Sharpe 4.52) while momentum fails (Sharpe -0.62) — this regime-timeframe relationship is theoretically sound
- A full-sample Sharpe of 4.52 trips our own red-flag threshold of 3.0 and must be treated with skepticism
- Sub-period Sharpe of 15.68 in Q2 2022 is unexplained and deeply suspicious despite multiple code audits finding no bug
- The strategy cannot be deployed without: out-of-sample validation across multiple regimes, transaction cost stress testing, and resolution of the Q2 anomaly
- Honest reporting of suspicious results is a professional obligation — the industry needs more uncertainty, not less
- A genuinely robust mean reversion strategy at Sharpe 1.5–2.0 is more valuable than a suspicious one at 4.52