Every strategy we build is developed on a specific set of assets. We pick symbols that have enough history, sufficient liquidity, and relevance to our trading universe. The problem is that this selection process introduces survivorship bias: we are testing strategies on assets that we already know survived, performed well enough to remain listed, and had interesting price action.
The question is: if we had picked different assets, would the strategy still work?
We built a systematic framework to answer this question using Monte Carlo simulation across our full 94-symbol Binance universe. The results forced us to kill two strategies we thought were profitable, adjust capital allocation for two more, and gave us confidence in three others.
What Survivorship Bias Looks Like in Practice
When you develop a momentum strategy, you naturally gravitate toward symbols that have trended significantly in the past — that is what gives you interesting backtesting data. When you develop a mean reversion strategy, you gravitate toward symbols that have oscillated in wide, regular bands.
The problem: symbols that trended significantly in your development window might have done so because of one-time events (a major exchange listing, a protocol upgrade, a market narrative) that are unlikely to repeat. Symbols that oscillated nicely might have done so because they were driven by a specific market dynamic that no longer exists.
When you then test your strategy on these symbols, you find strong performance. When you deploy to a broader universe, the performance degrades. The gap between development-sample performance and full-universe performance is the survivorship bias premium.
The Monte Carlo Framework
For each strategy, we ran the following procedure:
- Start with the full universe of 94 symbols available on Binance with sufficient history for our backtest period
- Note how many symbols the strategy was originally developed on (typically 10–20)
- Run 200 Monte Carlo trials: in each trial, randomly select the same number of symbols from the full 94-symbol universe and run the complete backtest
- Compare the strategy's reported Sharpe ratio (on curated symbols) to the distribution of Sharpe ratios from the 200 random selections
- Compute the percentile rank: where does the reported Sharpe fall in the random distribution?
The percentile rank is the key insight. A strategy at the 50th percentile performs about the same on curated symbols as on random ones — no survivorship bias. A strategy at the 95th percentile or above performs dramatically better on curated symbols, which means the symbol selection is doing more work than the strategy logic itself.
We set 200 trials as our minimum because the Sharpe distribution stabilizes around 150 trials, and 200 provides a comfortable margin. More trials improve precision but the incremental gain diminishes rapidly after 200.
Results: Seven Strategies, Seven Stories
RelStrMomentum (Relative Strength Momentum)
| Metric | Value |
|---|---|
| Reported Sharpe (curated) | 1.0 |
| Monte Carlo median Sharpe | -0.11 |
| Percentile rank | 99th |
| Verdict | Pure luck — retire immediately |
The strategy appeared to have a reasonable Sharpe of 1.0 on the symbols we chose. On random symbol selections, it lost money (median Sharpe -0.11). The entire apparent edge was in the curation. On 99% of random symbol selections, this strategy performed worse than on our curated set. We retired it.
TrendDipBuyer (Trend-Following Dip Buyer)
| Metric | Value |
|---|---|
| Reported Sharpe (curated) | 1.07 |
| Monte Carlo median Sharpe | 1.02 |
| Percentile rank | 70th |
| Verdict | Genuinely robust — keep unchanged |
The strategy performs nearly identically on random symbol selections (1.02) as on our curated set (1.07). The 70th percentile ranking means it is slightly better on our symbols, but the edge is genuine — it survives random asset selection. This is what a real edge looks like.
BetaRotation (Beta-Weighted Rotation)
| Metric | Value |
|---|---|
| Reported Sharpe (curated) | 1.45 |
| Monte Carlo median Sharpe | 1.12 |
| Percentile rank | 96th |
| Verdict | Lucky but sound — adjust expectations |
Interesting case. Every single one of the 200 random trials produced a Sharpe above 1.0 — the strategy has genuine positive alpha across the full universe. But our specific symbol selection happened to be particularly favorable, inflating the reported Sharpe from 1.12 (true edge) to 1.45 (curation premium). We continue using this strategy but size it based on the Monte Carlo median, not the reported Sharpe.
VolBreakout (Volatility Breakout)
| Metric | Value |
|---|---|
| Reported Sharpe (curated) | 0.85 |
| Monte Carlo median Sharpe | 0.79 |
| Percentile rank | 62nd |
| Verdict | Robust — modest but real edge |
Minimal survivorship bias. The strategy's modest Sharpe is genuine. The 62nd percentile ranking means our symbol selection provided only slight improvement over random. We keep this strategy with unchanged parameters.
MeanRevScalper (Mean Reversion Scalper)
| Metric | Value |
|---|---|
| Reported Sharpe (curated) | 1.92 |
| Monte Carlo median Sharpe | 0.43 |
| Percentile rank | 97th |
| Verdict | Mostly luck — redesign required |
The strategy captures a real effect (mean reversion exists across crypto), but the magnitude of the edge depends almost entirely on symbol selection. The underlying logic is sound — we preserved the mean reversion mechanics but redesigned the asset selection process to use a systematic screen across the full 94-symbol universe rather than a curated subset. The resulting strategy has Sharpe around 0.5, but it is robust.
CrossSectionalMom (Cross-Sectional Momentum)
| Metric | Value |
|---|---|
| Reported Sharpe (curated) | 0.72 |
| Monte Carlo median Sharpe | 0.68 |
| Percentile rank | 58th |
| Verdict | Robust — solid foundation |
Almost no survivorship bias. The cross-sectional approach (ranking assets by relative performance and going long top ranked, short bottom ranked) is inherently less susceptible to survivorship bias because it explicitly requires a diverse universe of assets to function. Confirming evidence that the strategy design itself provides protection.
AdaptiveTrend (Adaptive Trend Following)
| Metric | Value |
|---|---|
| Reported Sharpe (curated) | 1.31 |
| Monte Carlo median Sharpe | 0.91 |
| Percentile rank | 88th |
| Verdict | Moderately inflated — adjust sizing |
The strategy has a real edge (0.91 on random selections), but the reported Sharpe overstates it by approximately 0.4 due to favorable symbol selection. We continue using it but size based on the 0.91 Monte Carlo median.
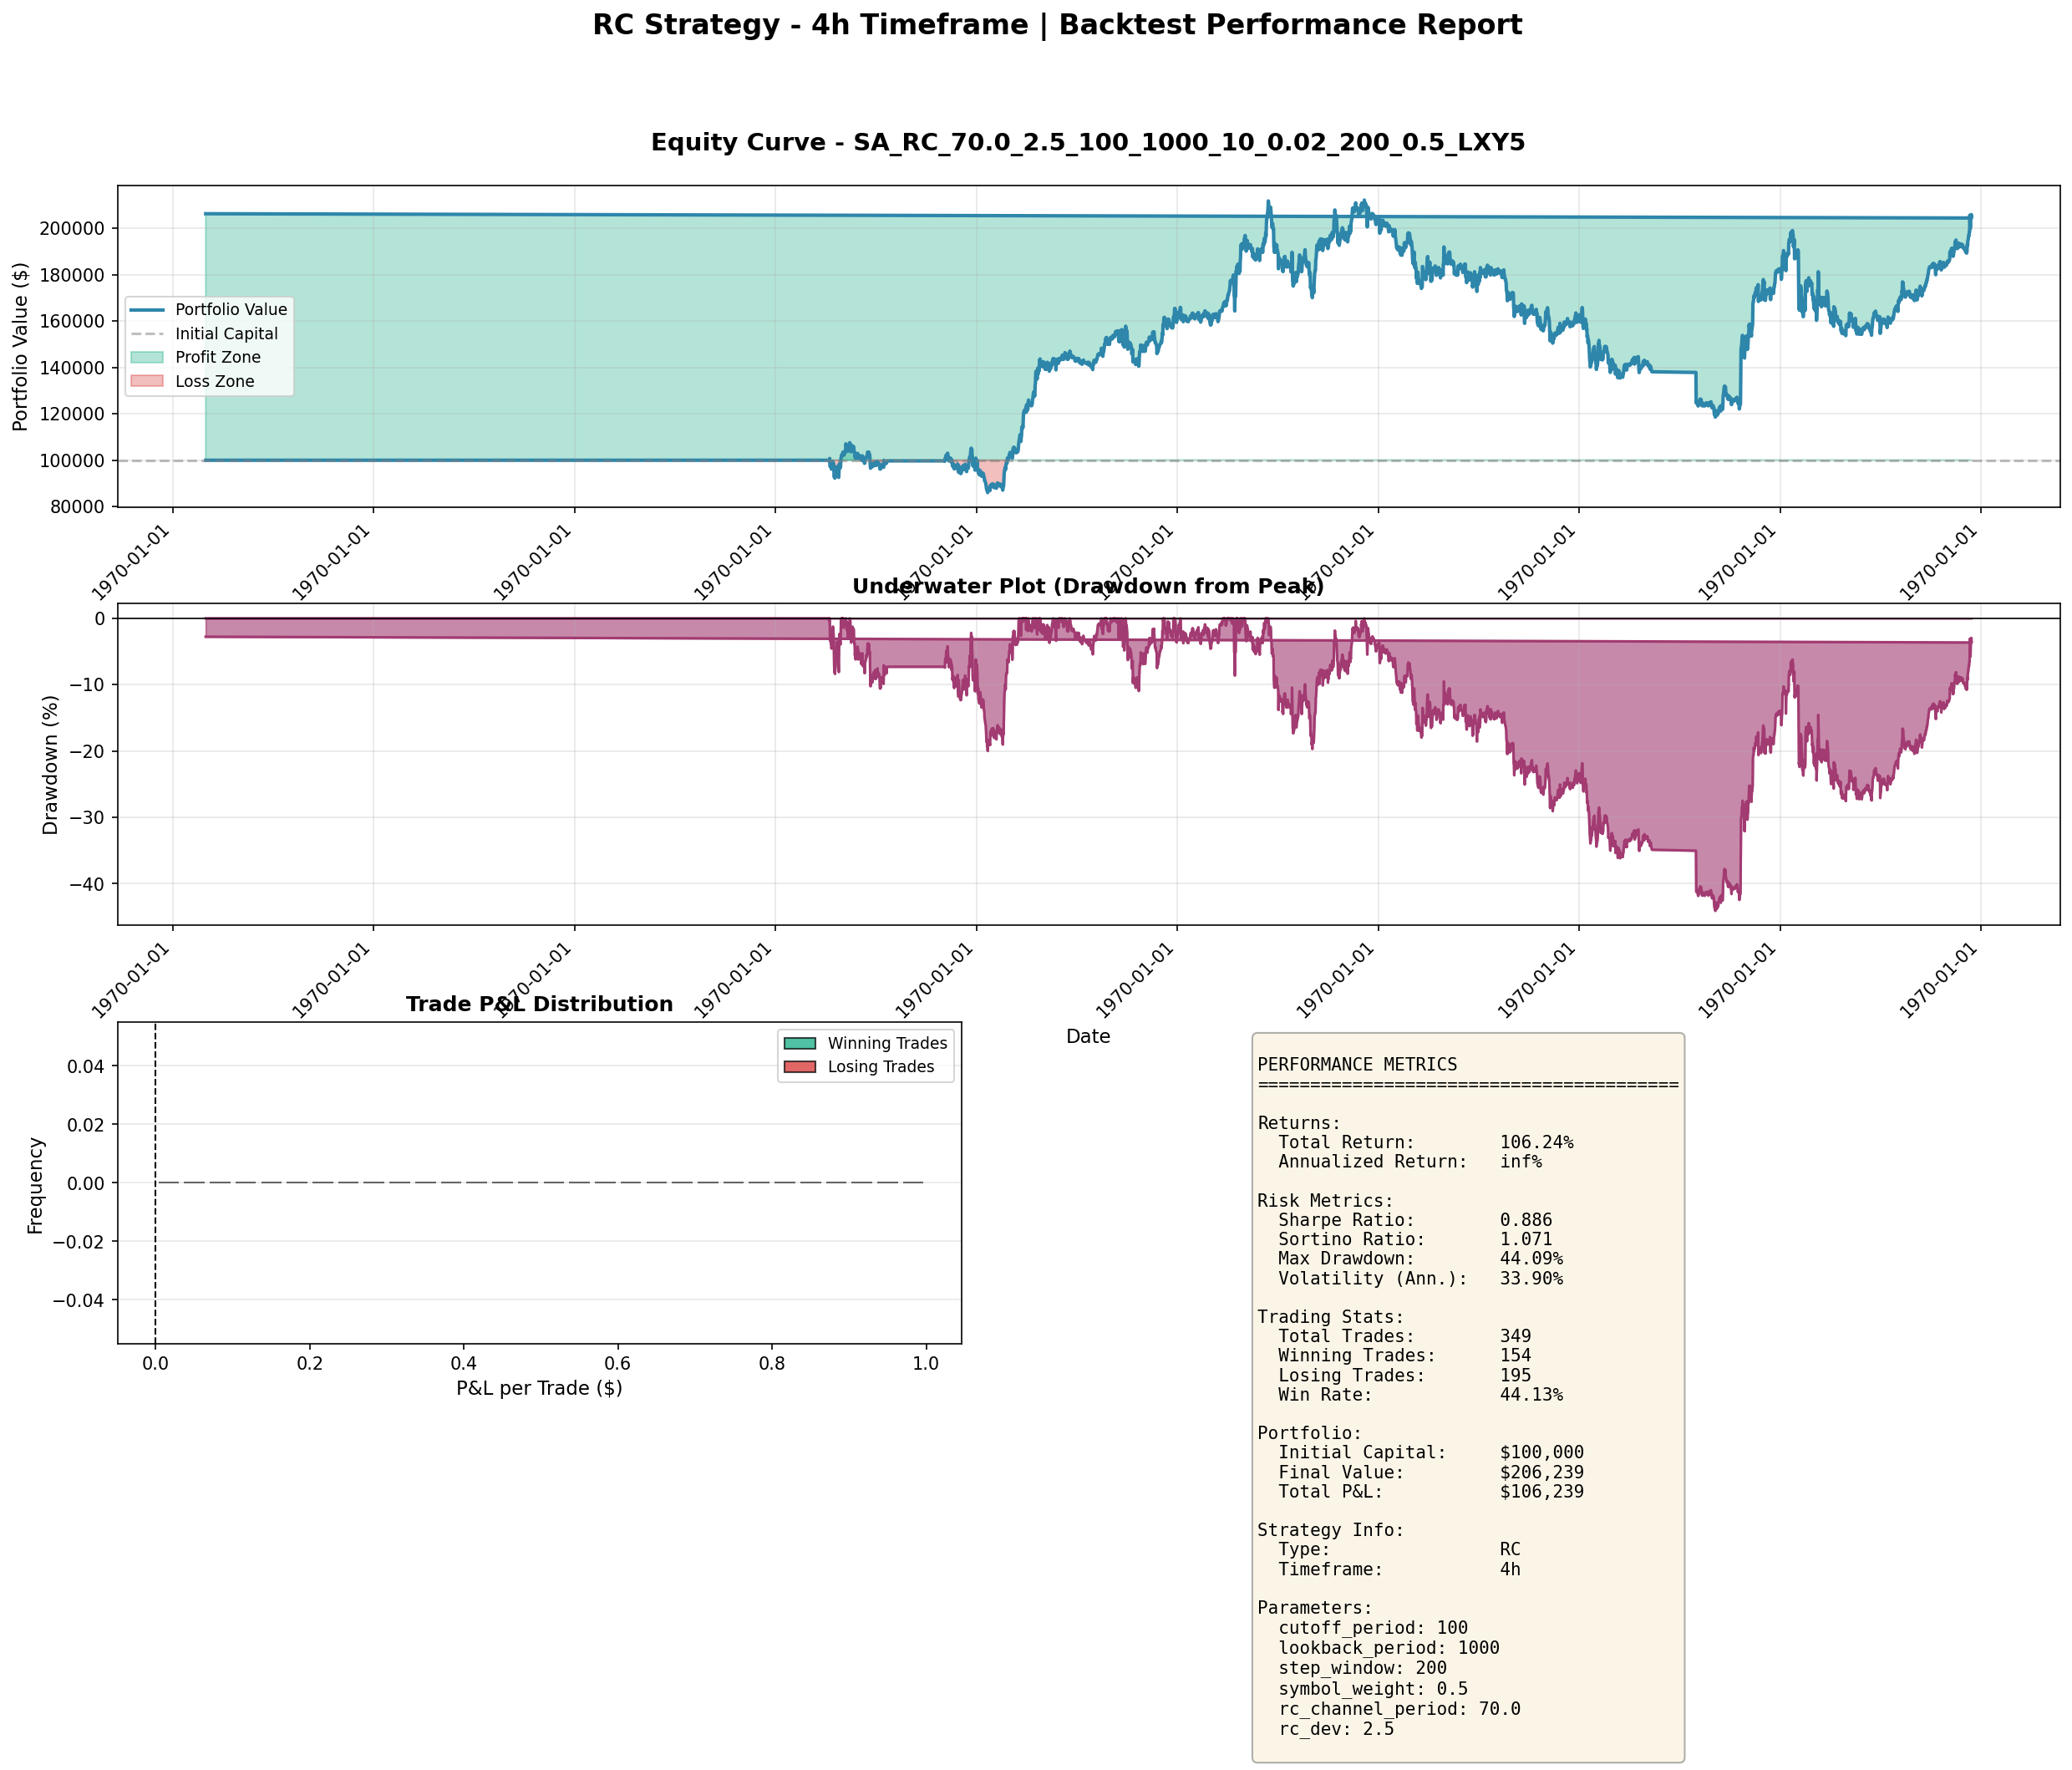
What Real Backtest Reports Look Like
The strategies that survived our audit produced equity curves with realistic characteristics. Here is the RC (Range Channel) strategy on 4-hour bars — one of our keepers:
And the RMD (Regime-Momentum-Deviation) strategy on 6-hour bars — a more aggressive one with higher return but deeper drawdowns:
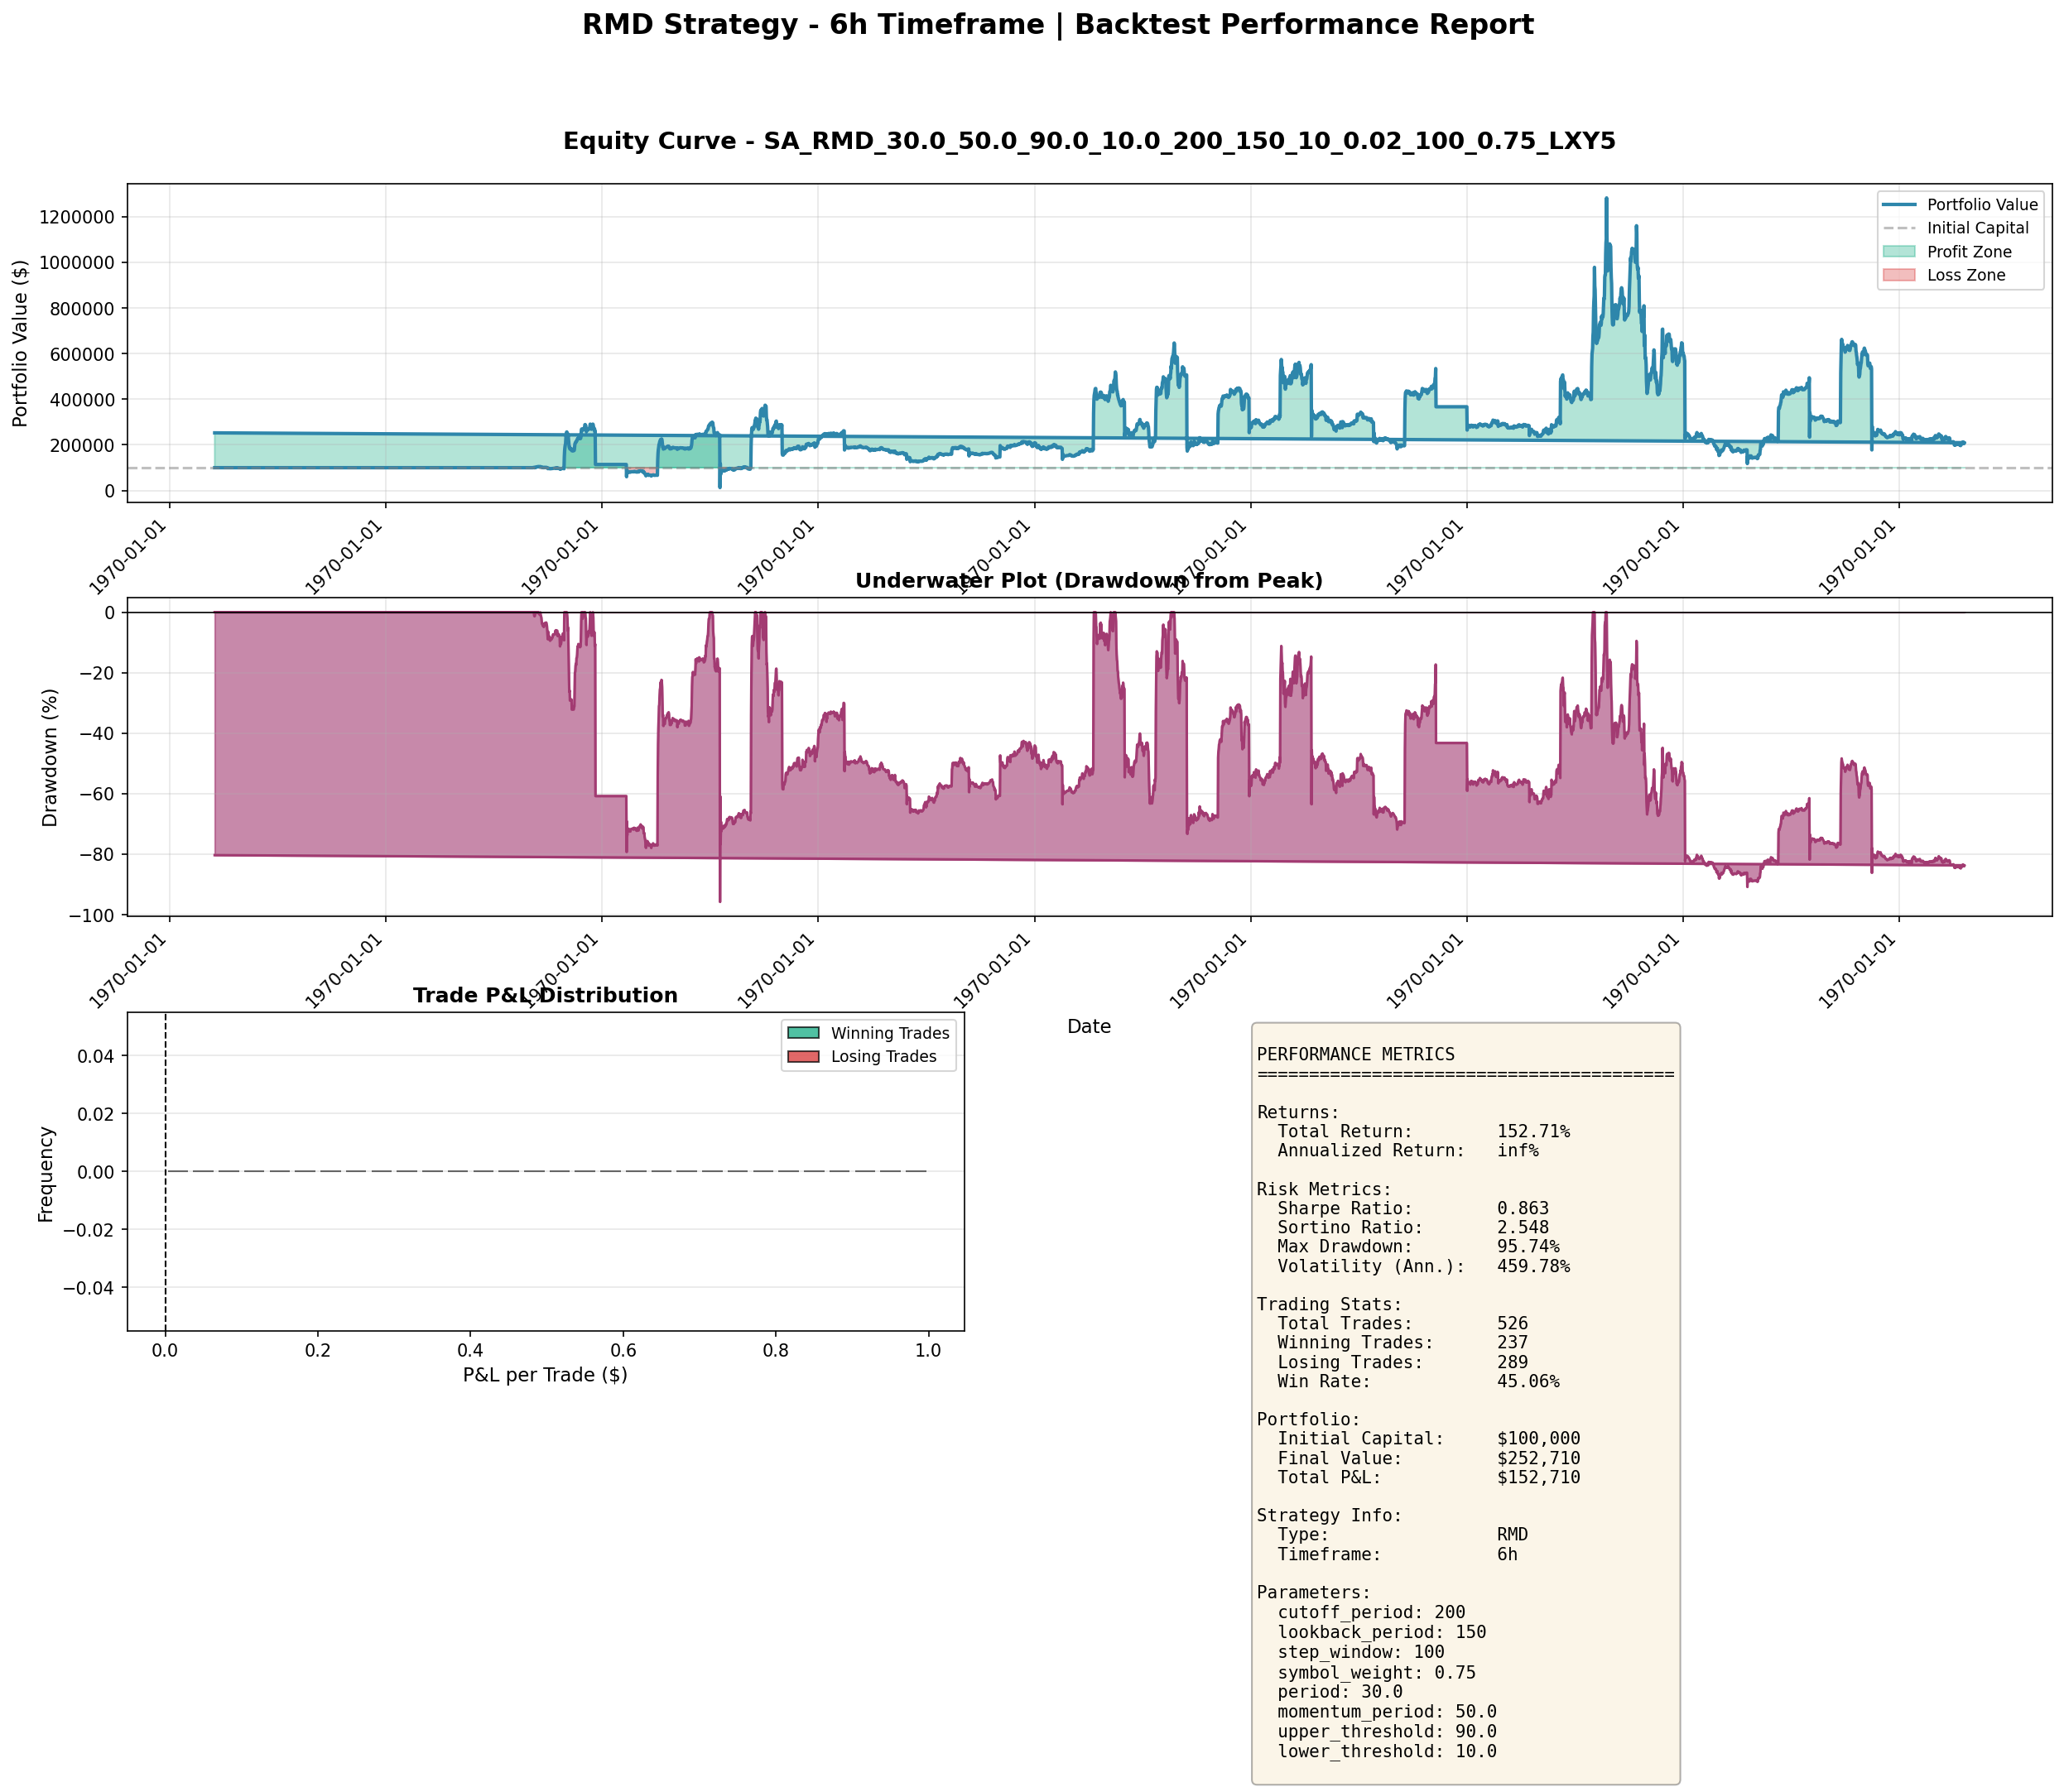
These are what honest backtests look like: positive edges, meaningful drawdowns, and Sharpe ratios in the 0.3–1.0 range. Nothing suspicious, but nothing fake.
What We Did About It
Killed RelStrMomentum. At the 99th percentile with median random Sharpe of -0.11, there is no genuine edge. The strategy lost money on 50%+ of all random symbol selections.
Killed MeanRevScalper in its original form. We preserved the mean reversion logic and rebuilt the symbol selection using a systematic z-score screen across the full universe, run fresh each quarter. The Sharpe dropped from 1.92 to approximately 0.5, but it now survives the survivorship audit at the 55th percentile.
Adjusted capital allocation for BetaRotation and AdaptiveTrend. Both strategies have real edges, but we now use the Monte Carlo median Sharpe for capital allocation and risk budgeting. This means smaller position sizes and more conservative risk limits than the reported Sharpe would have justified.
Retained TrendDipBuyer, VolBreakout, and CrossSectionalMom unchanged. All three passed the audit with minimal survivorship bias.
How to Run Your Own Survivorship Audit
- Define your full available universe (all symbols with sufficient history and liquidity)
- Record how many symbols your strategy uses in its current form
- Run 200+ Monte Carlo trials, each time randomly selecting that many symbols from the full universe
- Run the complete backtest on each random selection
- Compare your reported Sharpe to the Monte Carlo distribution
- If your percentile rank exceeds 90, your symbol selection is doing more work than your strategy
Two additional checks worth adding: - Time-period robustness: Run the same Monte Carlo procedure on different historical windows (e.g., 2020–2022 vs. 2022–2024). A strategy whose Monte Carlo distribution changes dramatically between periods is time-period dependent, not just symbol-selection dependent. - Universe expansion test: Add synthetic "bad" assets (e.g., coins that crashed 90% in the backtest period) to your universe. A survivorship-biased strategy will show particularly sharp degradation when these are included in the random selections.
Takeaways
- Survivorship bias is not just a theoretical concern — it inflated the Sharpe ratio of 3 of 7 strategies we audited
- A Sharpe of 1.0 can be pure luck if it depends on right symbol selection (RelStrMomentum: 99th percentile)
- A Sharpe of 1.07 can be genuinely robust if it works on random symbols (TrendDipBuyer: 70th percentile)
- The percentile rank from Monte Carlo is more informative than the Sharpe ratio alone
- Use the Monte Carlo median Sharpe, not the reported Sharpe, for capital allocation decisions on strategies with high percentile ranks
- Cross-sectional strategies are inherently less susceptible to survivorship bias due to their universe-relative design
- Run at least 200 trials on your full available universe to get a stable distribution